
Like most things I work on, I find it useful to know the current state and the expected state. Understanding these states allows you to determine if you're on track, or perhaps, how far off-track you are.
As it relates to technology and especially for IoT devices, the ability to monitor, analyse, and react to changes in a system's state is critical to effective operations.
In this blog I'll touch on a few systems I monitor in the context of my home environment and provide some insights to help get you started monitoring the stuff that you care about.
What I monitor
- home network
- Tesla charging
- air quality
- brentonbaker.com / cloud infrastructure
- a few other services (Vault, security systems etc)
The monitoring stack
The stack consists of Prometheus and Grafana. Prometheus is an open-source monitoring and alerting toolkit designed to collect, store, query, and alert on time-series data. Prometheus is part of a broader ecosystem that includes several components that provide comprehensive monitoring and alerting capabilities:
- Prometheus Server: The heart of the system. The Prometheus server scrapes, stores, and queries time-series data, providing real-time insights.
- Prometheus Alertmanager: The Alertmanager component handles alerting. It allows you to define and manage alerts based on metric thresholds, predefined conditions, or complex queries. It can group, deduplicate, and route alerts for rapid resolution.
- Prometheus Push Gateway: Sometimes, systems generate metrics that don't naturally fit the pull-based model used by Prometheus. The Push Gateway is an optional component that enables pushing metrics from short-lived jobs and batch processes, filling the gap in the Prometheus ecosystem. You'll see an example of this with my Tesla & AQ monitoring.
- PromQL: Prometheus Query Language (PromQL) is a specialised query language for time-series data. It allows you to perform complex queries and mathematical operations on your metrics.
- Grafana: To visualise and explore metrics, you can pair Prometheus with Grafana. Grafana allows you to create visualisations and dashboards that make it easy to understand your data. You'll see some examples coming up...
Defining the metrics that matter
Now we understand the tools, systems/services we want to monitor. Next is to define the metrics that matter. Be intentional about what you're collecting and how you will use these metrics to inform decisions or trigger actions.
I want to satisfy the following objectives
- identify when there are sustained periods of high upload and/or download on my home WAN connection
- monitor resource constraints on my cloud infrastructure
- determine if my website is down/unavailable for more than 5 minutes
- track the cost per charge when I charge my Tesla at home
- track the lifetime cost of Telsa charging at home
- identify when my Tesla has finished charging at home
- identify how many new visitors access my website within a 24 hour period
- be notified when someone accesses the Vault
- be notified when the Vault disconnects from power
- monitor the air quality in my home office and graph the last 24 hours
Get building
To achieve objective 1, we can use the Prometheus SNMP Exporter (note: SNMPv3 supports encryption). The SNMP Exporter reads a config file snmp.yml that contains the OIDs to walk.
To achieve objective 2, we can use the Prometheus Node Exporter.
To achieve objective 3 & 9, we can use the Prometheus Blackbox Exporter.
For most other objectives, we need to build our own tooling to extract the metrics and expose them via a HTTP endpoint for Prometheus to scrape. I've provided two different examples below of how to achieve this.
Tesla charging metrics
The Tesla home charger exposes metrics via an API at http://charger-IP/api/1/vitals & http://charger-IP/api/1/lifetime however, Prometheus can't scrape from these endpoints directly. Below is my Python script that queries the Tesla API and pushes the metrics to Prometheus PushGateway every 10 seconds.
#!/usr/bin/env python3

import requests
from prometheus_client import CollectorRegistry, Gauge, push_to_gateway
import ssl
ssl._create_default_https_context = ssl._create_unverified_context


endpoint_url = 'http://<brenton-home-charger-IP>:8018/api/1/vitals'

pushgateway_url = 'https://monitoring.brentonbaker.com:9091'


registry = CollectorRegistry()


response = requests.get(endpoint_url)

if response.status_code == 200:
    # Extract metrics from the JSON response
    data = response.json()
    for key, value in data.items():
        metric_name = key.replace('-', '_') + '_metric'
        metric_description = key.replace('_', ' ').title()

        # Check if the value is numeric
        if isinstance(value, (int, float)):
            metric = Gauge(metric_name, metric_description, registry=registry)
            metric.set(float(value))


    push_to_gateway(pushgateway_url, job='brenton_tesla_model3', registry=registry)
    print('Metrics pushed to Prometheus Pushgateway successfully.')
else:
    print('Error:', response.text)
Air Quality metrics
Since my AQ sensor has a PHP library for extracting data from the serial interface, I decided to continue using PHP. The PHP script below updates values of the AQ metrics through POST requests made by another service (extract shown in the second script below) and provides the metrics in a format that Prometheus can scrape.
<?php

// File path to store the values
$dataFile = __DIR__ . '/data.json';

// Load existing values from file if available
if (file_exists($dataFile)) {
    $data = json_decode(file_get_contents($dataFile), true);
    $v1 = $data['v1'];
    $v2 = $data['v2'];
} else {
    $v1 = 0;
    $v2 = 0;
}

if ($_SERVER['REQUEST_METHOD'] === 'POST') {
    // Handle POST request to update v1 and v2 values
    if (isset($_POST['v1']) && isset($_POST['v2'])) {
        $v1 = $_POST['v1'];
        $v2 = $_POST['v2'];

        // Save the updated values to file
        $data = ['v1' => $v1, 'v2' => $v2];
        file_put_contents($dataFile, json_encode($data));
    }
}

// Generate the metrics
$metrics = "# HELP v1_description small air particles\n";
$metrics .= "# TYPE v1_small_particles gauge\n";
$metrics .= "v1_small_particles $v1\n";
$metrics .= "# HELP v2_description large air particles\n";
$metrics .= "# TYPE v2_large_particles gauge\n";
$metrics .= "v2_large_particles $v2\n";


echo $metrics;
function upload($v1, $v2)
{
$this->log("sending $v1 and $v2 data");
$url = 'http://<ip>:8016/metrics';
$data = [
'v1' => $v1,
'v2' => $v2
];
$ch = curl_init($url);
curl_setopt($ch, CURLOPT_POST, 1);
curl_setopt($ch, CURLOPT_POSTFIELDS, http_build_query($data));
curl_exec($ch);
curl_close($ch);
$this->listen();
}Alerting
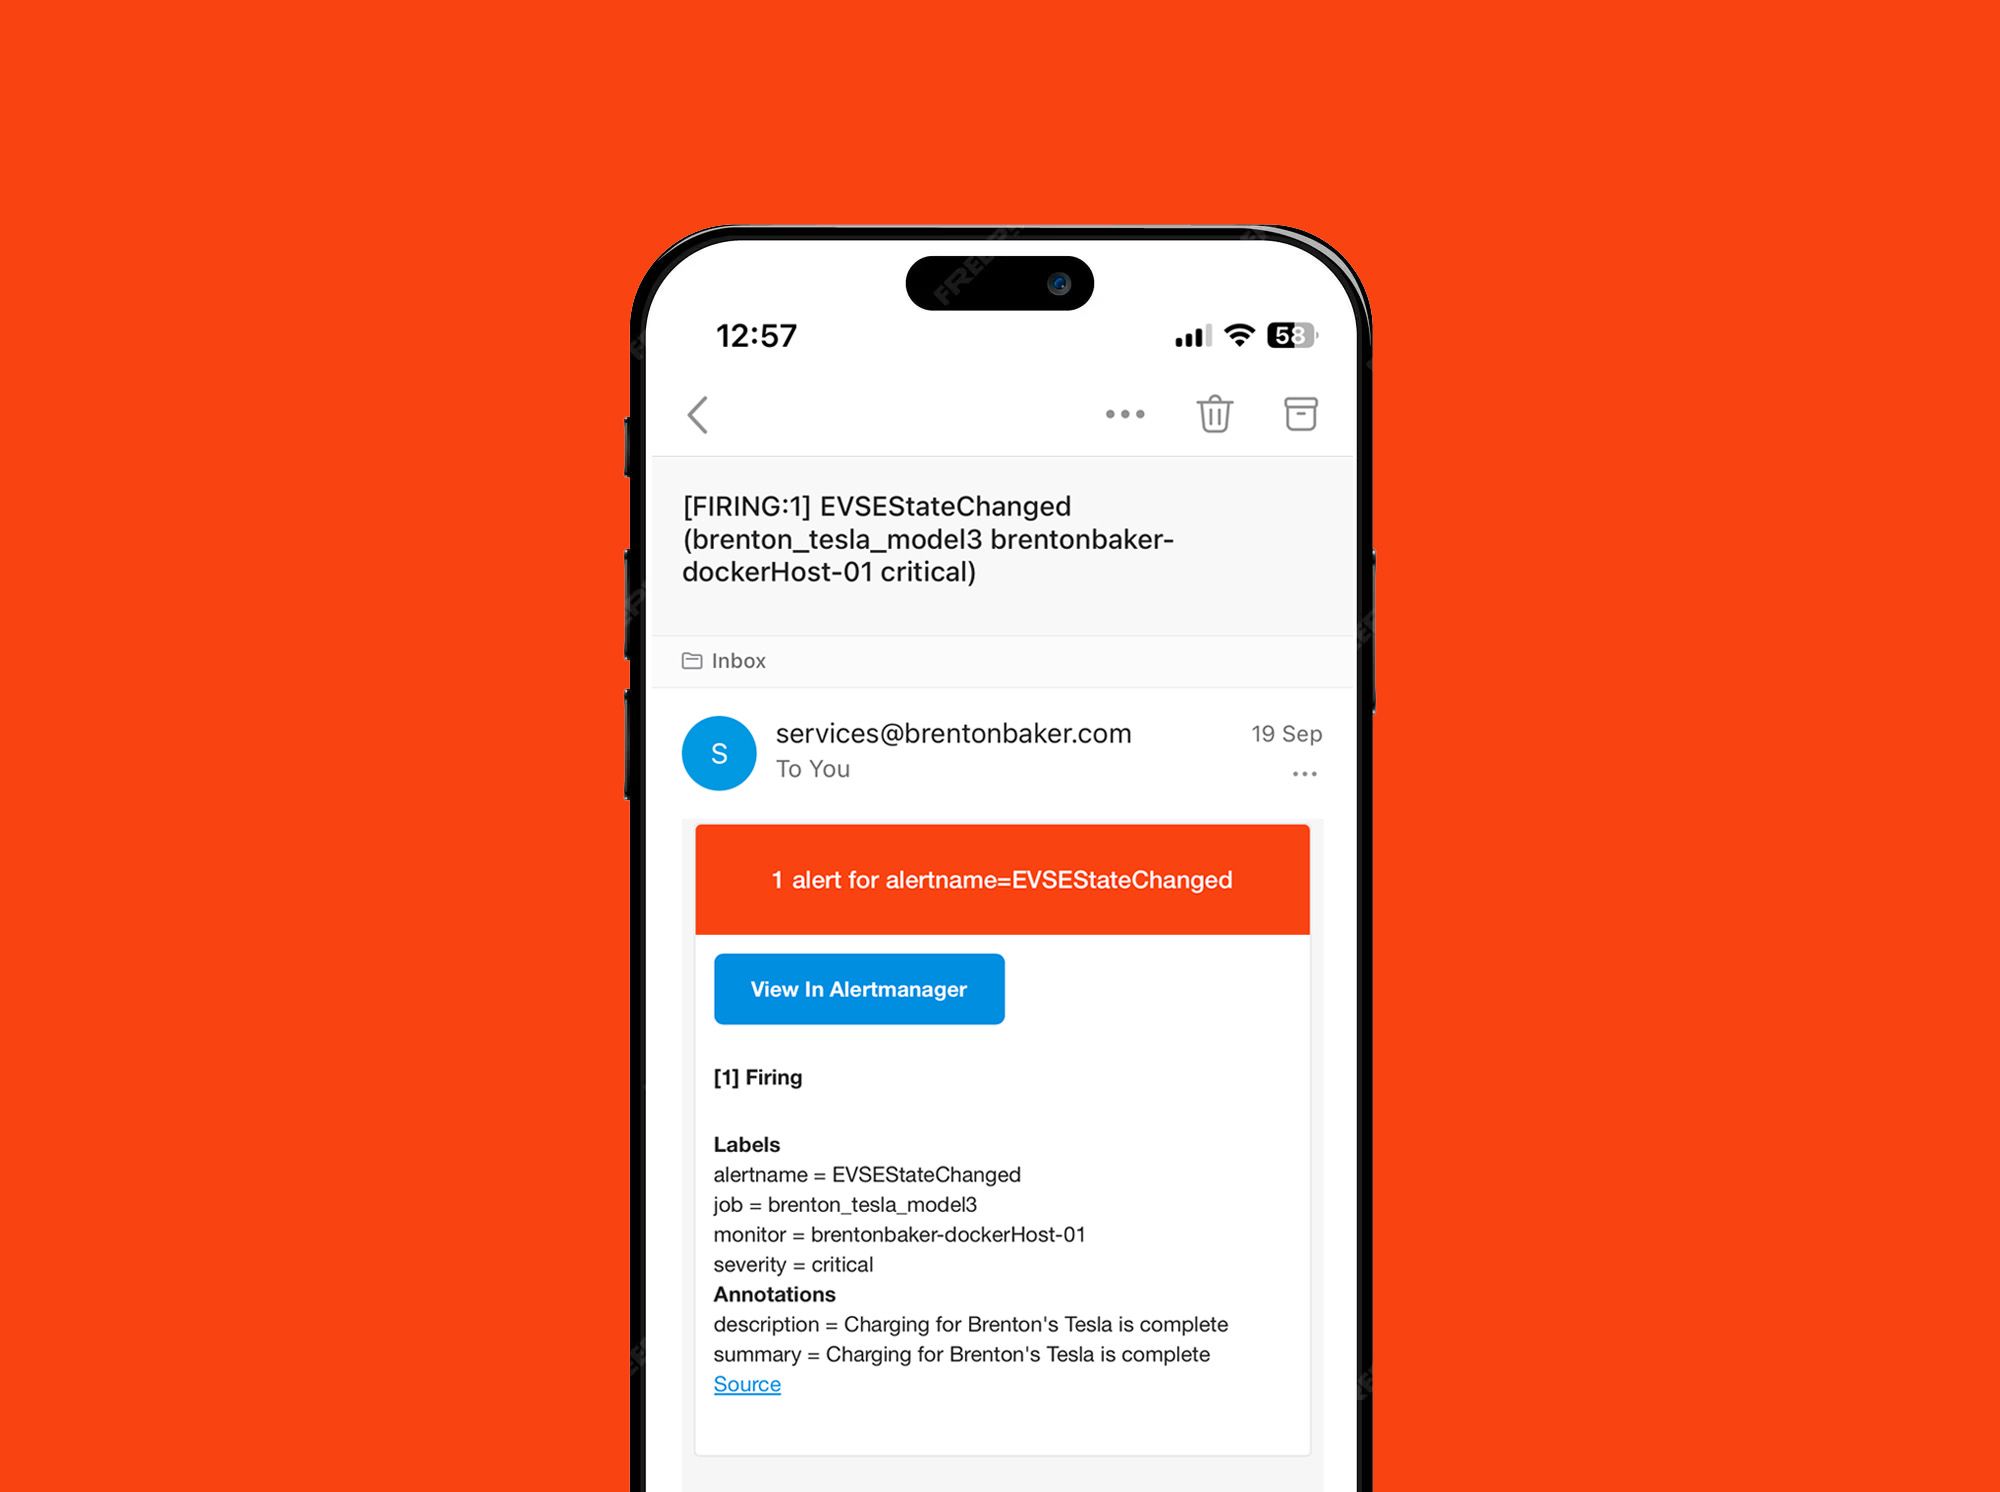
Prometheus AlertManager can be configured to accomodate alerting based on defined conditions. Below is a rule that sends an email when my Tesla has finished charging.
- name: brenton_tesla_charging
  rules:
  - alert: EVSEStateChanged
    expr: evse_state_metric{job="brenton_tesla_model3"} == 4
    for: 1m
    labels:
      severity: critical
    annotations:
      summary: "Charging for Brenton's Tesla is complete"
      description: "Charging for Brenton's Tesla is complete"
receivers:
- name: email
email_configs:
- send_resolved: false
to: <your-email-address>
from: <your-service-email-address>
hello: localhost
smarthost: smtp.sendgrid.net:587
auth_username: apikey
auth_password: <secret>
headers:
From: <your-service-email-address>
Subject: '{{ template "email.default.subject" . }}'
To: <your-email-address>
html: '{{ template "email.default.html" . }}'
require_tls: true
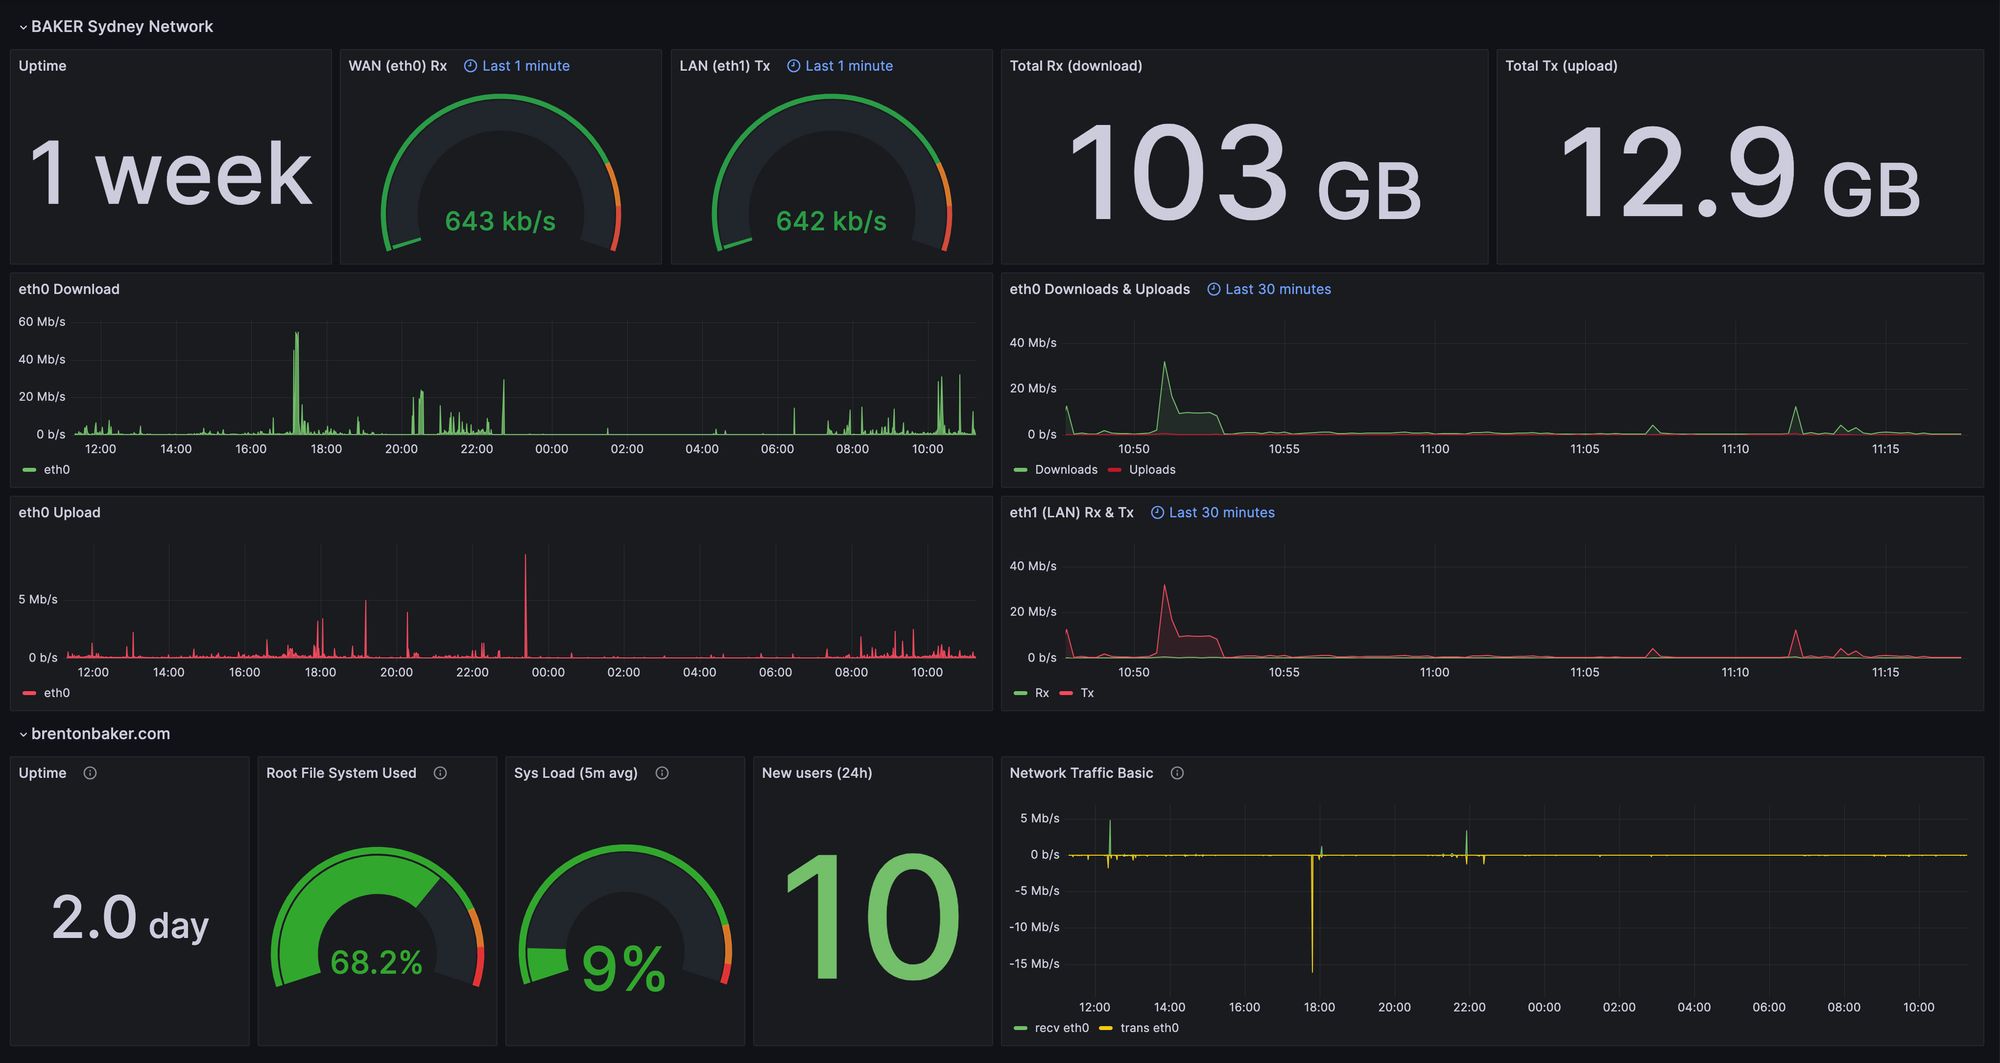
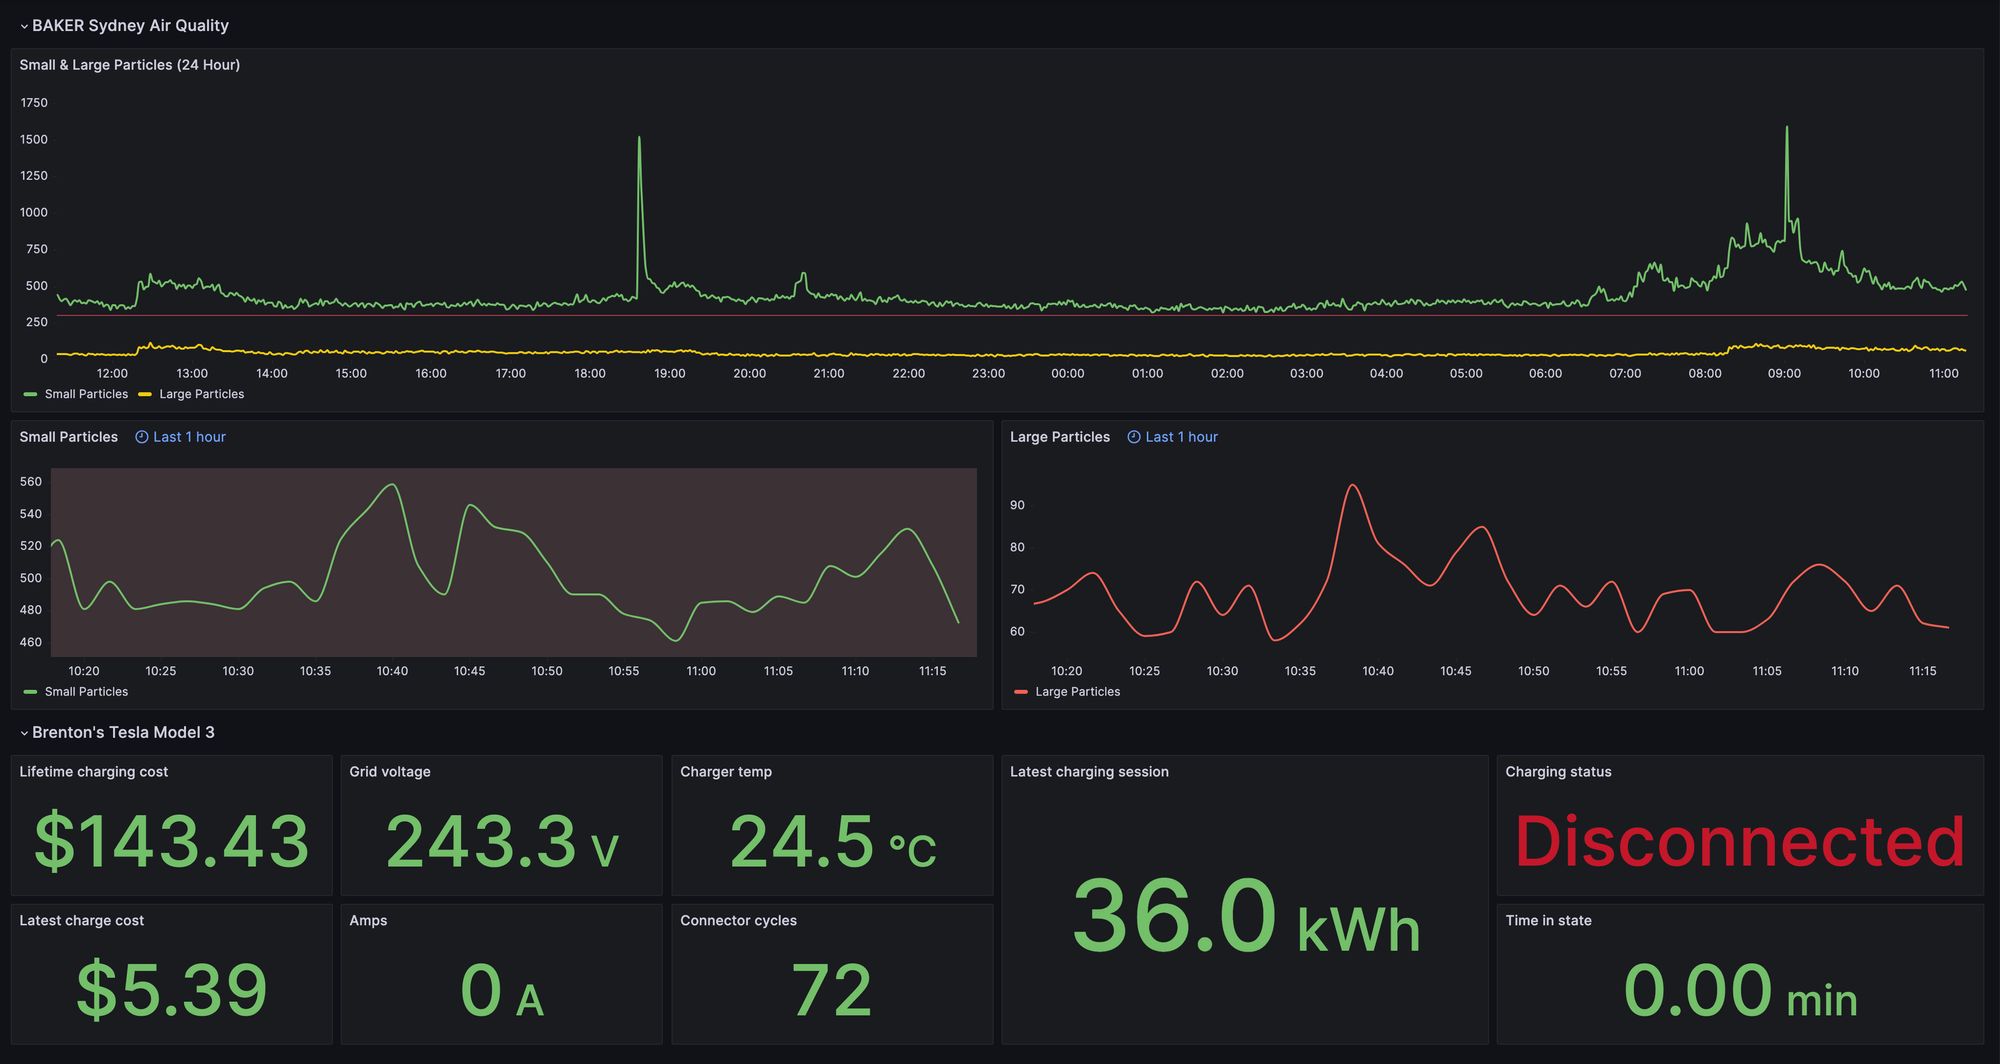
templates: []Display the data
Now the monitoring stack is configured, the data can be queried to build and display real-time dashboards using PromQL in Grafana.